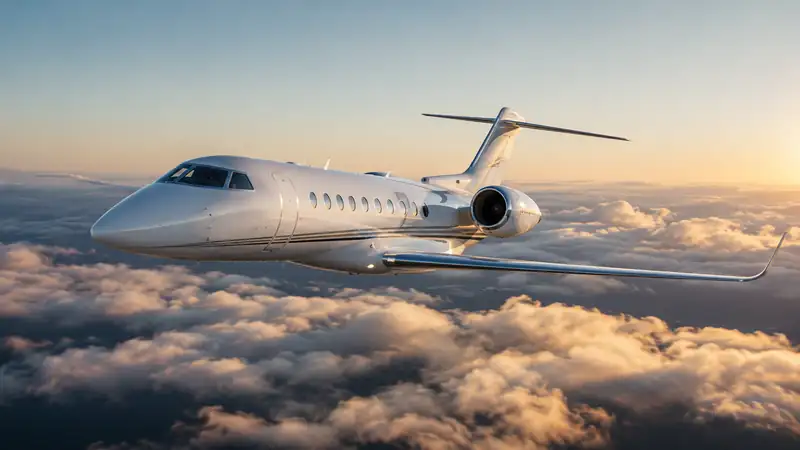
Private jets flew a record 3.9 million departures in 2025, the world fleet reached ~25,500 aircraft, and manufacturers delivered 854 new business jets — here are 60+ verified private jet statistics for 2026, every one sourced and dated.
Private jets flew a record 3.9 million departures in 2025, the world fleet reached ~25,500 aircraft, and manufacturers delivered 854 new business jets — here are 60+ verified private jet statistics for 2026, every one sourced and dated.\n\nMost statistics pages recycle each other's figures without dates or sources. This one doesn't. We compiled it from primary industry data — GAMA, WingX Advance, JETNET, EBAA, Honeywell, Knight Frank, the ICCT, IATA, EASA, and peer-reviewed research — and we flag every estimate that doesn't meet that bar. Where credible sources disagree, we show you both numbers and explain why.\n\nJournalists and researchers: you're welcome to cite any figure on this page. A ready-to-paste citation block is at the bottom.\n\nOn this page: Key takeaways · Market size · Fleet · Flights · Airports & routes · Who flies · Emissions · Costs · Empty legs · Economy · Market structure · Safety · Forecasts · FAQ · Sources\n\n## Key takeaways\n\n- 2025 was the busiest year in business aviation history: 3.9 million business jet departures worldwide, up 5% from 2024 (WingX Advance).\n- The world's installed business jet fleet reached ~25,500 aircraft in April 2026 — more than double the ~11,000 of 2001 (JETNET iQ).\n- Manufacturers delivered 854 new business jets in 2025, up 11.8% from 764 in 2024 (GAMA).\n- North America accounts for 72% of global business jet traffic. Europe grew just 1% in 2025 — while Africa (+15%), Latin America (+11%), and the Middle East (+7%) grew fastest (WingX).\n- Paris-Le Bourget is Europe's busiest business aviation airport: 54,724 business aviation movements in 2024 — 92% of the airport's total traffic (EBAA).\n- Roughly 256,000 people — about 0.003% of the world's adults — used private jets in 2023 (Gössling et al., Communications Earth & Environment).\n- Knight Frank counts 713,626 individuals worth over $30 million in 2026 — 89 new ones every day since 2021 (Altrata's competing model counts ~511,000; see who flies).\n- Private jets emitted between 15.6 million tonnes (Mt) of direct CO2 (Gössling et al., Nature portfolio) and 19.5 Mt counting all greenhouse gases (ICCT) in 2023 — roughly 1.8–4% of civil aviation's footprint, depending on scope.\n- 47.4% of private jet flights cover less than 500 km (Gössling et al., 2024).\n- The fractional fleet has grown more than 65% since 2019, to ~1,300 aircraft (Honeywell).\n\n## How to read these numbers (60 seconds that most stats pages skip)\n\nBusiness aviation data is full of traps. Four distinctions matter:\n\n1. Departures ≠ movements. WingX counts departures (one flight = one departure). EBAA counts movements (one flight = one departure and one arrival). Never add them together or divide one by the other.\n2. "Installed", "based", and "registered" fleets are different things. "Installed" is JETNET's term for the delivered fleet still in existence, wherever it sits. France had 495 business aircraft based in the country in 2024, but only 351 registered there (EBAA). Neither is wrong — an aircraft can be registered in one state and operated from another.\n3. "Business aviation" ≠ "business jets." Some datasets include turboprops and bizliners; others don't. We name the scope with each figure.\n4. Market-size dollar figures are estimates, not measurements. Research firms disagree by a factor of ~1.6 on the same market (see below). Physical data — flights, deliveries, fleet counts — is far more reliable than "market value" figures.\n\n## 1. Private jet market size in 2026: the honest numbers\n\nEstimates of the global private jet charter market range from $16.38bn (Mordor Intelligence) to $25.87bn (Fortune Business Insights) for 2025 — and that $9.5bn gap itself tells the story: there is no audited "market size", only diverging models.\n\n| Indicator | Value | Period | Source | Reliability |\n|---|---|---|---|---|\n| Global private jet charter market (est.) | $25.87bn | 2025 | Fortune Business Insights | Low (research-firm estimate) |\n| Same market, competing estimate | $16.38bn | 2025 | Mordor Intelligence | Low (research-firm estimate) |\n| Charter market forecast | $48.19bn by 2034 (CAGR ~7.1%) | 2026–2034 | Fortune Business Insights | Low |\n| Global jet card market (est.) | $5.98bn (2025) → $6.36bn (2026) | 2025–2026 | Fortune Business Insights | Low |\n| New business jet deliveries, OEM backlogs, and traffic | see sections 2–3 | 2025–2026 | GAMA / WingX / OEMs | High |\n\nThe definitions behind those dollar figures (broker vs operator revenue, memberships, gross flight value vs commissions) aren't harmonized, so never present one of them as the market size. If you need a defensible growth signal, use physical data instead: deliveries up 11.8%, flight activity at an all-time record, and global charter broker Air Charter Service — $1.34bn in self-reported FY2025 revenue — growing its private jet division 19.1% in FY2025 and 26% in H1 2026 (company figures).\n\n## 2. How many private jets are there? Fleet and deliveries\n\nThere are approximately 25,500 business jets in service worldwide as of April 2026 (JETNET iQ's "installed fleet" count) — more than double the ~11,000 of 2001.\n\n| Statistic | Value | Period | Source |\n|---|---|---|---|\n| Global installed business jet fleet | ~25,500 aircraft | April 2026 | JETNET iQ |\n| Same fleet in 2001 | ~11,000 aircraft | 2001 | JETNET iQ |\n| Average fleet age (global) | 18.1 years | Feb 2025 | JETNET / Airbus Corporate Jets analysis |\n| US-based fleet | 15,492 aircraft — of a 24,442-aircraft global fleet in the same Feb 2025 dataset (~63%) | Feb 2025 | JETNET / ACJ |\n| European share of the world fleet | 11% | 2025 | Honeywell Global Business Aviation Outlook |\n| New business jets delivered | 854 (+11.8% vs 764 in 2024) | 2025 | GAMA |\n| Fractional fleet worldwide | ~1,300 aircraft, >65% growth since 2019 | 2025 | Honeywell |\n| Pre-owned jets listed for sale | 6.58% of fleet (3,117 aircraft) | June 2025 | JETNET |\n| Average pre-owned asking prices | −9% YoY | H1 2025 | JETNET |\n| Bombardier order backlog | $21.8bn | 30 June 2026 | Bombardier Q2 2026 results |\n| Embraer Executive Aviation backlog | $7.8bn (+5% YoY) | Q2 2026 | Embraer |\n| Best-selling light jet | Embraer Phenom 300 — 14th consecutive year, >900 in service | 2025 | Embraer / GAMA |\n\nUnder the surface, the fleet is changing shape. The fractional fleet is up more than 65% since 2019, with NetJets (845 aircraft as of March 2026) and Flexjet (340+) dominating, and Flexjet ordering 182 Embraer jets in a single February 2025 deal. Meanwhile supply is tight: OEM backlogs are deep — Bombardier alone holds $21.8bn — stretching delivery positions years out and supporting new-aircraft values, even as average pre-owned asking prices fell 9% year-on-year.\n\n> Citable: The world's business jet fleet has more than doubled since 2001, reaching ~25,500 aircraft in April 2026 (JETNET iQ).\n\n## 3. How many private jet flights per year? 2025 set the record\n\nPrivate jets flew a record 3.9 million departures worldwide in 2025, up 5% from 2024 (WingX Advance, 8 Jan 2026) — the busiest year ever recorded. The precise count compiled from WingX data by Private Jet Card Comparisons is 3,878,336 departures (+4.6% on that count).\n\n| Statistic | Value | Period | Source |\n|---|---|---|---|\n| Global business jet departures | 3.9 million — all-time record, +5% YoY | 2025 | WingX Advance |\n| North America's share of traffic | 72% | 2025 | WingX |\n| Europe: all business aviation segments | 555,254 flights (+1% vs 2024) | 2025 | WingX data via Forbes |\n| Europe: charter + fractional flights | 397,909 (+45% vs 2019) | 2025 | WingX data via PJCC |\n| Europe's 2022 peak (for comparison) | 600,382 flights | 2022 | WingX data via Forbes |\n| Regional growth: Africa / Latin America / Middle East / Asia | +15% / +11% / +7% / +4% | 2025 | WingX |\n| Fastest-growing month globally | September 2025 (+9% YoY; Q3 led the year) | 2025 | WingX |\n| Most-flown category in Europe | Light jets: >100,000 charter/fractional departures (+2%) | 2025 | WingX data via PJCC |\n| Europe, June 2026 | −0.5% vs June 2025 | June 2026 | WingX |\n| France, June 2026 | +6.7% vs June 2025 | June 2026 | WingX |\n\nThe headline hides a split market. Global traffic set an all-time record, but Europe has essentially plateaued — +1% in 2025, still below its 2022 peak, and slightly negative in mid-2026 — while North America powers ahead and emerging regions boom. Within that flat European picture, France was one of the bright spots in June 2026 at +6.7%, a divergence worth watching for anyone pricing European charter capacity.\n\nNote: WingX counts departures; don't compare these to EBAA "movements" below.\n\n> Citable: 2025 was the busiest year in business aviation history — 3.9 million business jet departures worldwide, up 5% from 2024 (WingX Advance).\n\n## 4. The busiest private jet airports and routes\n\nParis-Le Bourget is Europe's busiest business aviation airport, with 54,724 business aviation movements in 2024 — 92% of the airport's total traffic (EBAA).\n\n| Statistic | Value | Period | Source |\n|---|---|---|---|\n| Europe's busiest business aviation airport | Paris-Le Bourget: 54,724 business aviation movements | 2024 | EBAA Yearbook |\n| Business aviation's share of Le Bourget's total traffic | 92% | 2024 | EBAA |\n| France: total business aviation movements | 243,461 (−3% YoY) | 2024 | EBAA |\n| Business aviation share of French air traffic | 9% | 2024 | EBAA |\n| Europe's most-flown business aviation route | Le Bourget–Geneva: 1,518 flights in H1 2024 | H1 2024 | WingX data via Business Airport International |\n| Busiest US route | Palm Beach–Teterboro: 2,930 flights | H1 2024 | WingX data via Business Airport International |\n\nBusiest city pairs involving France (EBAA France profile, 2024, movements in both directions):\n\n| City pair | Movements 2024 |\n|---|---|\n| Le Bourget–Geneva | 3,363 |\n| Le Bourget–Nice | 2,641 |\n| Nice–Geneva | 1,749 |\n| Nice–Farnborough | 1,460 (−13%) |\n| Le Bourget–London Luton | 1,439 (+4%) |\n\nThe busiest French pairs all connect four cities — Paris, Geneva, Nice, and London — and Le Bourget–Geneva was also Europe's most-flown business aviation route in WingX's H1 2024 ranking. For what these corridors cost at the extreme end, see [the world's most expensive private jet routes]. (The country-pair and France totals come from the EBAA Yearbook, whose detailed data is members-only and cannot be independently re-verified from public pages; EBAA's detailed 2025 airport rankings are likewise members-only. We'll update when the 2026 Yearbook data becomes citable.)\n\n## 5. Who actually flies private\n\nRoughly 256,000 people — about 0.003% of the world's adults — flew by private jet in 2023 (Gössling et al., Communications Earth & Environment). The entire user base would fit in a mid-size city, while the wealth pool that feeds it adds 89 ultra-wealthy individuals a day.\n\n| Statistic | Value | Period | Source |\n|---|---|---|---|\n| People who used private jets worldwide | ~256,000 (~0.003% of adults) | 2023 | Gössling et al., Communications Earth & Environment |\n| Ultra-high-net-worth individuals (>$30m) | 713,626 — up from 551,435 in 2021 | 2026 | Knight Frank Wealth Report |\n| New UHNWIs per day | 89 (162,191 added 2021–2026) | 2021–2026 | Knight Frank |\n| UHNWIs in Europe | 183,953 (25.8% of world total) | 2026 | Knight Frank data via Euronews |\n| UHNWIs in France | 21,528 — 3rd in Europe behind Germany (38,215) and the UK (27,876) | 2026 | Knight Frank data via Euronews |\n| Billionaires worldwide | 3,110 | 2026 | Knight Frank |\n| Competing UHNW estimate | 510,810 worldwide | mid-2025 | Altrata World Ultra Wealth Report |\n\nNote the methodological split: Knight Frank's Wealth Sizing Model counts ~713,000 UHNWIs; Altrata's database-driven model counts ~511,000–557,000. Always attribute the number to its source — "713,626 according to Knight Frank" — rather than citing "the" UHNWI population.\n\n> Citable: About 256,000 people — 0.003% of the world's adult population — flew by private jet in 2023 (Gössling et al., 2024).\n\n## 6. Private jet emissions statistics\n\nPrivate jets emitted between 15.6 Mt of direct CO2 (Gössling et al., Nature portfolio) and 19.5 Mt counting all greenhouse gases (ICCT) in 2023 — roughly 1.8–4% of civil aviation's footprint depending on scope, and rising fast.\n\n| Statistic | Value | Period | Source |\n|---|---|---|---|\n| Private jet greenhouse gas emissions | up to 19.5 Mt GHG (≈4% of civil aviation, +25% in 10 years) | 2023 | ICCT |\n| Private jet direct CO2 emissions | 15.6 Mt CO2 (≈1.8% of commercial aviation) | 2023 | Gössling et al., Nature portfolio |\n| Growth in private jet emissions | +46% | 2019–2023 | Gössling et al. |\n| Average emissions per jet, per year | ~810 tonnes of GHG — equivalent to 177 cars | 2023 | ICCT |\n| Average emissions per flight | ~3.6 tonnes of CO2 | 2023 | Gössling et al. |\n| Flights under 500 km | 47.4% of all private jet flights | 2019–2023 | Gössling et al. |\n| US share | 65% of flights, 55% of emissions | 2023 | ICCT |\n| EU-27 share of emissions | 12% — roughly a quarter of that from France | 2023 | ICCT |\n| Per-passenger multiple vs commercial | 5–14× (and ~50× vs rail) | 2021 analysis, still cited by T&E in 2026 | Transport & Environment |\n| Private jet emissions outside the current EU ETS scope | 67% | 2026 | Transport & Environment |\n| EU ETS free allocations for aviation | −50% in 2025; 100% auctioning from 2026 | 2025–2026 | European Commission |\n| SAF share of global jet fuel | 0.3% in 2024 (1 Mt, doubled YoY); ~0.7% expected 2025 | 2024–2025 | IATA |\n| SAF actually supplied at EU airports | 0.6% of fuel (193 kt) | 2024 | EASA ReFuelEU report |\n| SAF price vs fossil kerosene (EU) | €2,085/t vs €734/t — a 2.8× premium | 2024 | EASA |\n| EU SAF blending mandate | 2% from 2025 → 6% by 2030 | 2025–2030 | ReFuelEU Aviation |\n\nWhy do the ICCT and Nature figures differ? The ICCT counts all greenhouse gases and models >90% of global activity; Gössling et al. count direct CO2 only, from ADS-B flight tracking of 72 aircraft types. Cite either — with its scope — but don't average them. And treat the industry's own framing (EBAA cites 0.8% of EU aviation emissions) as what it is: a stakeholder figure with a narrower perimeter.\n\nTwo more distinctions keep this section honest. The EU's SAF mandate (2% from 2025) is an obligation on fuel suppliers, not a measure of what business aviation actually burns — actual SAF supplied at EU airports was 0.6% in 2024 (EASA). And the regulatory squeeze is real: as of 2026, aviation pays for 100% of its EU ETS allowances, yet T&E calculates that two-thirds of private jet emissions still fall outside the scheme — which is why private aviation stays at the center of Europe's tax debate.\n\nRelated: [our CO2 emissions study] compares emissions route by route.\n\n> Citable: 47.4% of private jet flights cover less than 500 km, and the average private jet emits ~810 tonnes of greenhouse gases a year — the footprint of 177 cars (Gössling et al., 2024; ICCT, 2025).\n\n## 7. What private jet charter costs\n\nIndicative 2025–26 rates run from about $2,600–3,500 per hour for a light jet to $8,000–13,000 for a heavy jet — but one caveat up front: there is no audited public database of realized charter prices. The ranges below come from published operator rate cards, useful for orientation, not quotes.\n\n| Aircraft category | Indicative hourly rate | Source |\n|---|---|---|\n| Turboprop | ~$2,000/h | Published operator rate cards, 2025–26 |\n| Light jet | $2,600–3,500/h | Published operator rate cards |\n| Midsize | $3,500–5,500/h | Published operator rate cards |\n| Super-midsize | $5,500–7,500/h | Published operator rate cards |\n| Heavy jet | $8,000–13,000/h | Published operator rate cards |\n| Ultra-long-range | $10,000–14,000+/h | Published operator rate cards |\n\nDemand spikes break these ranges: around the 2025 Super Bowl, light jet rates reportedly jumped from about $4,000 to $7,000/h (a single-operator claim by BlackJet, unverified).\n\n## 8. Empty legs\n\nOperator estimates suggest ~40% of all private jet flights fly empty (repositioning), and 30–35% of charter volume is sold as empty legs — different scopes, and neither is verified by a primary source.\n\n| Statistic | Value | Period | Source | Reliability |\n|---|---|---|---|---|\n| Flights repositioning empty | ~40% of all flights | 2025 | Business Airport International / SkyAccess | Low (operator estimate) |\n| Empty legs as share of charter volume | 30–35% | undated | Business Travel Executive | Low |\n| Advertised empty leg discounts | 25–75% off standard charter | 2026 | Operator-advertised (BLADE, Amalfi Jets) | Medium |\n\nNo primary data source (WingX, ARGUS, EBAA) publishes a verified empty-leg rate — every widely quoted "40% of flights are empty" figure traces back to operator estimates. Treat it as an order of magnitude, not a fact. What is solid: the discounts are real and large. Flyius lists [live empty leg offers] across Europe, and our quote database will let us publish the first verified median empty-leg discount in the Q4 2026 update of this page.\n\n## 9. Economic footprint\n\nBusiness aviation supported ~450,000 jobs and contributed ~€100bn to European GDP in 2025, according to the industry's own association (EBAA, drawing on Oxford Economics research).\n\n| Statistic | Value | Period | Source |\n|---|---|---|---|\n| Jobs supported by business aviation in Europe | ~450,000 | 2025 | EBAA (industry association) |\n| Contribution to European GDP | ~€100bn | 2025 | EBAA / Oxford Economics |\n| Airports served by business aviation in Europe | >1,500 — including ~1,000 with no scheduled airline service | 2025–2026 (EBAA communications) | EBAA |\n| Average time saved per business aviation trip | 127 minutes vs fastest commercial alternative | 2025–2026 | EBAA |\n| Medical flights flown per year | ~70,000 | 2023 | EBAA / ClimbingFast |\n| France: jobs supported | 101,500 | 2024 | EBAA |\n| France: economic output | €32.1bn | 2024 | EBAA |\n| US general aviation: jobs / output | 1.33m jobs / $339.2bn output / $178.1bn GDP | 2023 data; study published 2025 | PwC for NBAA |\n\nSource note: EBAA is the industry's advocacy body and these figures come from research it commissioned. An earlier 2025 Oxford Economics release put European employment at ~371,000–374,000 jobs; EBAA's 2026 release moved that to 450,000. The GDP figure (€100bn) is consistent across both. We flag this so you don't have to.\n\nThe single most underused statistic here: business aviation serves ~1,000 European airports that have no scheduled airline service at all — the strongest connectivity argument the sector has, and one rarely quantified.\n\n## 10. Market structure: who's who in 2026\n\nNo audited market-share ranking of charter players exists — revenue definitions are too different to compare — but the fleet, hours, and revenue data below sketch the landscape.\n\n| Player | Key figure | Period | Source |\n|---|---|---|---|\n| NetJets | 845 aircraft; 719,086 flight hours in North America (+8%) | 2025–Mar 2026 | ARGUS TRAQPak data via Private Jet Card Comparisons |\n| Flexjet | 340+ aircraft; 284,533 hours; $3.8bn revenue, $398m EBITDA in 2024 (analyst-reported, unaudited); LVMH's L Catterton took a 20% stake in July 2025 | 2024–2026 | Flexjet / ARGUS via PJCC |\n| Vista Global | ~$2.9bn revenue; 206 group aircraft end-2025 (down from 266 end-2023) | 2025 | S&P Global Ratings via PJCC |\n| Air Charter Service | $1.34bn revenue FY2025 (+10.3%); private jets +19.1%; H1 2026: $845m (+26% private jets; jet card sales +85%) | 2025–2026 | ACS press releases / AIN |\n| Market concentration | NetJets ≈ 11.5% of US charter/fractional flight hours | 2023 (latest available) | Third-party analysis of ARGUS flight-hour data (PJCC) |\n\nDespite the mega-brands, charter remains deeply fragmented: the largest player holds roughly a tenth of US flight hours, and no authority publishes a count of Europe's AOC-holding business aviation operators — EASA notes that AOCs are issued and supervised nationally, and EBAA alone counts 700+ member companies. That fragmentation is the reason comparison platforms exist: on Flyius, one request reaches [150+ certified operators] at once.\n\n## 11. Private jet safety statistics\n\nThere is no honest single number for "how safe are private jets" — activity data gaps make simple comparisons with airlines misleading — but here is what primary sources actually publish.\n\n| Statistic | Value | Period | Source |\n|---|---|---|---|\n| Commercial aviation reference rate | 1.13 accidents per million flights (7 fatal accidents on 40.6m flights) | 2024 | IATA Safety Report |\n| NTSB special study of US charter (Part 135) operations | >500 fatal and non-fatal accidents reviewed | 2010–2022 | NTSB, published Aug 2024 |\n| Accidents with deficient dispatch/operational control | 12 | study corpus | NTSB |\n| Resulting NTSB safety recommendations | 3 new + 2 reiterated | 2024 | NTSB |\n| IS-BAH ground-handling standard adoption | 300+ locations worldwide | Nov 2023 (dated — to refresh) | IBAC |\n\nWhy no "X times safer/more dangerous" figure? The NTSB itself warns that activity data (flight hours by segment) is too patchy to compute reliable accident rates for parts of the charter sector, and commercial-style rates per million flights aren't published for business aviation on a comparable basis. Any page giving you a simple multiple is skipping that caveat. What can be said: charter (Part 135) operations are more heterogeneous than airlines, oversight is national, and third-party audit standards — ARGUS ratings, WYVERN Wingman, IS-BAO/IS-BAH — exist precisely because regulation alone doesn't equalize standards. No public 2025–26 figure documents what share of operators hold these certifications.\n\n## 12. The next decade: forecasts\n\nHoneywell forecasts 8,500 new business jet deliveries worth $283bn over 2026–2035 (~3% annual growth); JETNET iQ's competing model says 9,700 jets and $335bn — the ~1,200-jet gap between them is the real error bar.\n\n| Forecast | Value | Horizon | Source |\n|---|---|---|---|\n| New business jet deliveries | 8,500 jets worth $283bn (~3%/year growth) | 2026–2035 | Honeywell Global Business Aviation Outlook |\n| Competing forecast | 9,700 jets / $335bn | 2025–2034 | JETNET iQ |\n| Deliveries in 2026 | +5% vs 2025 | 2026 | Honeywell |\n| Operators planning to fly as much or more | 91% | 2026 | Honeywell operator survey |\n| Global fleet by 2035 | ~30,400 aircraft (CAGR 2.15%) | 2035 | JETNET iQ |\n| Europe's share of new deliveries | ~14% | 2026–2028 | Honeywell |\n\nThese are projections, not facts — Honeywell surveys operators, JETNET iQ runs a proprietary model. Both agree on steady growth; Honeywell additionally expects a modest European share (~14% of deliveries) and large-cabin jets to represent about two-thirds of delivery value.\n\n## FAQ\n\nHow many private jets are there in the world in 2026?\nAbout 25,500 business jets are in service worldwide as of April 2026 (JETNET iQ's "installed fleet" count) — up from roughly 11,000 in 2001. The US held 15,492 business aircraft as of February 2025 (JETNET/ACJ analysis); Europe holds about 11% of the world fleet (Honeywell).\n\nHow many private jet flights operate per year?\n2025 set an all-time record with 3.9 million business jet departures worldwide, up 5% from 2024 (WingX Advance). That works out to roughly 10,600 flights per day (Flyius calculation from WingX's annual total). North America generated 72% of the traffic.\n\nHow much does it cost to charter a private jet per hour?\nIndicative 2025–26 rates run from about $2,600–3,500/hour for a light jet to $8,000–13,000 for a heavy jet and $10,000–14,000+ for ultra-long-range aircraft (published operator rate cards). No audited public price database exists — Flyius publishes route-level estimates from real operator quotes on [what a private jet actually costs].\n\nWhat is the busiest private jet airport in Europe?\nParis-Le Bourget, with 54,724 business aviation movements in 2024 — 92% of the airport's total traffic (EBAA). Europe's most-flown route in WingX's H1 2024 ranking was Le Bourget–Geneva.\n\nHow much CO2 does a private jet emit?\nOn average ~3.6 tonnes of CO2 per flight, and ~810 tonnes of greenhouse gases per aircraft per year — the footprint of 177 cars (Gössling et al. 2024; ICCT 2025, data year 2023). Per passenger, that's 5–14× a commercial flight (T&E, 2021 analysis still cited in its 2026 publications).\n\nWhat percentage of aviation emissions come from private jets?\nBetween roughly 1.8% and 4% of civil aviation's emissions in 2023, depending on scope: Gössling et al. count 15.6 Mt of direct CO2 (~1.8%), while the ICCT counts up to 19.5 Mt of all greenhouse gases (~4%). Both agree emissions are rising fast: Gössling et al. measure +46% between 2019 and 2023, and the ICCT counts +25% over ten years.\n\nWhat share of private jet flights are empty legs?\nOperator estimates suggest ~40% of all private jet flights fly empty (repositioning), and 30–35% of charter volume is sold as empty legs — different scopes, neither verified by a primary source. Advertised empty-leg discounts range from 25% to 75% off standard charter.\n\nIs the private jet market growing?\nYes, on every physical indicator: record traffic (+5% in 2025), deliveries up 11.8%, growing multi-billion-dollar OEM backlogs, and forecasts of ~8,500–9,700 new jets over the next decade. Europe is the exception — roughly flat since 2024.\n\n## Methodology\n\nCompiled 18 August 2026 by Flyius Research from primary sources: GAMA, WingX Advance, JETNET/JETNET iQ, EBAA, Honeywell, Knight Frank, Altrata, the ICCT, IATA, EASA, the European Commission, NBAA/PwC, the NTSB, company releases (Bombardier, Embraer, ACS), and peer-reviewed research (Gössling et al., Communications Earth & Environment, 2024). Figures are reproduced at the precision their sources publish; where a more precise figure exists only in secondary reporting (e.g., Private Jet Card Comparisons' compilation of WingX data), we say so inline. Research-firm market estimates (Fortune Business Insights, Mordor Intelligence) are labeled as such and never presented as measurements. Figures older than 24 months are retained only where no newer verifiable data exists and are dated inline. Units are never mixed: WingX departures and EBAA movements are reported separately throughout, and CO2-only figures are never merged with all-GHG figures.\n\nAll headline figures were re-checked against their public sources on 18 August 2026. Figures that cannot be independently re-verified from open pages — EBAA members-only Yearbook data and secondary compilations (PJCC) — are labeled inline, and the Fortune Business Insights jet card values could not be confirmed outside the paywalled report.\n\nFound an error, or have newer primary data? Email contact@flyius.com — we correct fast and credit the correction.\n\n<a id="cite"></a>\n## Cite these statistics\n\nYou may reuse any statistic on this page with attribution. Suggested citation:\n\n> Source: Flyius Research, "Private Jet Statistics 2026" — flyius.com/private-jet-statistics — compiled from GAMA, WingX, EBAA, JETNET, Knight Frank, ICCT, and others.\n\n## Sources\n\nAll URLs re-verified 18 August 2026.\n\nPrimary industry and institutional sources\n1. WingX Advance, Busiest year ever for global business aviation, 8 Jan 2026 — https://wingx-advance.com/weekly-bulletin/busiest-year-ever-for-global-business-aviation/\n2. WingX Advance, North America powers ahead as Europe stalls and the Middle East sinks, 8 Jul 2026 — https://wingx-advance.com/weekly-bulletin/north-america-powers-ahead-as-europe-stalls-and-the-middle-east-sinks/\n3. GAMA, 2025 Aircraft Shipment and Billing Report, Feb 2026 — https://gama.aero/news-and-events/press-releases/gama-releases-2025-aircraft-shipment-and-billing-report/ ; quarterly data: https://gama.aero/facts-and-statistics/quarterly-shipments-and-billings/\n4. JETNET iQ Market Monitor, May 2026 (ed. 3) — https://www.jetnet.com/resources/blog/jetnet-iq-market-monitor-may-26-edition-3 ; JETNET Mid-2025 Market Snapshot — https://www.jetnet.com/resources/blog/mid-2025-market-snapshot-business-jet-inventory-pricing-activity ; JETNET fleet analysis via Airbus Corporate Jets, June 2025 (world fleet 24,442; US 15,492; average age 18.1 years) — https://www.acj.airbus.com/en/newsroom/web-story/2025-06-study-reveals-brazil-has-the-second-largest-business-jet-fleet-in-the\n5. EBAA Yearbook, country and airport profiles (2024 data; detailed data members-only) — https://yearbook.ebaa.org/\n6. EBAA, The invisible jet stream Europe needs (jobs, GDP, connectivity, time savings), 2026 — https://www.ebaa.org/industry-updates/the-invisible-jet-stream-europe-needs-to-fuel-its-global-momentum-is-business-aviation/ ; medical flights: ClimbingFast (EBAA/GAMA campaign) — https://climbingfast.eu/news/french-business-aviation-under-threat/\n7. Oxford Economics for EBAA/GAMA, The socio-economic benefits of business aviation in Europe, 29 Jan 2025 — https://www.oxfordeconomics.com/resource/the-socio-economic-benefits-of-business-aviation-in-europe/\n8. Honeywell, Global Business Aviation Outlook, 34th ed., 13 Oct 2025 — https://www.honeywell.com/us/en/press/2025/10/honeywell-forecast-shows-demand-for-new-business-jets-at-record-levels-continued-growth-expected-for-next-decade\n9. Knight Frank, The Wealth Report — Wealth Sizing Model 2026, Apr 2026 — https://www.knightfrank.com/research/article/2026/4/wealth-sizing-model-2026-results\n10. Knight Frank data on European and French UHNWIs, as reported by Euronews, 7 May 2026 — https://www.euronews.com/business/2026/05/07/europes-ultra-rich-club-grew-by-26-in-five-years-led-by-germany\n11. Altrata, World Ultra Wealth Report 2025 (30 Sep 2025) and 2026 edition — https://altrata.com/reports/world-ultra-wealth-report-2026\n12. Gössling, S. et al., Private aviation is making a growing contribution to climate change, Communications Earth & Environment, 7 Nov 2024, DOI 10.1038/s43247-024-01775-z — https://www.nature.com/articles/s43247-024-01775-z\n13. ICCT, Air and greenhouse gas pollution from private jets, 2023, 27 June 2025 — https://theicct.org/publication/air-and-ghg-pollution-from-private-jets-2023-jun25/\n14. Transport & Environment, Private jets: can the super-rich supercharge zero-emission aviation? (2021 multipliers) — https://www.transportenvironment.org/articles/private-jets-can-the-super-rich-supercharge-zero-emission-aviation ; Boosting aviation decarbonisation through the revision of the EU ETS, 2026 — https://www.transportenvironment.org/articles/boosting-aviation-decarbonisation-through-the-revision-of-the-eu-ets\n15. European Commission, ReFuelEU Aviation (Reg. (EU) 2023/2405) — https://transport.ec.europa.eu/transport-modes/air/environment/refueleu-aviation_en ; Reducing emissions from aviation (EU ETS) — https://climate.ec.europa.eu/areas-action/transport-decarbonisation/reducing-emissions-aviation_en\n16. EASA, ReFuelEU Aviation Annual Technical Report, 22 Oct 2025 — https://www.easa.europa.eu/en/document-library/general-publications/refueleu-aviation-annual-technical-report-2025\n17. EASA, Air operator certificate (AOC) — https://www.easa.europa.eu/en/domains/air-operations/air-operator-certificate-aoc\n18. IATA, Disappointingly Slow Growth in SAF Production, 10 Dec 2024 — https://www.iata.org/en/pressroom/2024-releases/2024-12-10-03/ ; IATA Safety Report 2024, 26 Feb 2025 — https://www.iata.org/en/pressroom/2025-releases/2025-02-26-01/\n19. NBAA / PwC, General Aviation's Contribution to the US Economy, 19 Feb 2025 — https://nbaa.org/2025-press-releases/general-aviation-provides-robust-contribution-to-u-s-economy/\n20. NTSB, Safety and Industry Data Improvements for Part 135 Operations (AIR-24-03), 13 Aug 2024 — https://www.ntsb.gov/news/press-releases/Pages/NR20240813.aspx\n21. IBAC, IS-BAH surpasses 300 locations, Nov 2023 — https://ibac.org/posts/the-ibac-international-standard-for-business-aircraft-handling-is-bah-surpasses-300-locations-since-inception\n\n**Company sources**\n22. Air Charter Service, FY2025 results, Feb 2026 — https://www.aircharterservice.com/about-us/news-features/news/air-charter-services-revenues-grow-by-more-than-10-percent-to-1-point-34-billion-us-dollars ; H1 2026 ($845m), Aug 2026 — https://www.ainonline.com/aviation-news/business-aviation/2026-08-10/air-charter-service-reaches-845m-h1-revenue\n23. Bombardier, Q2 2026 results, 30 Jul 2026 — https://bombardier.com/en/media/news/bombardier-reports-significant-second-quarter-free-cash-flow-growth-and-strong\n24. Embraer, Q2 2026 backlog, 24 Jul 2026 — https://www.embraer.com/media-center/en/?mediatype=NEWS&detail=27964 ; Flexjet 182-jet order, Feb 2025 — https://www.forbes.com/sites/douggollan/2025/02/05/flexjet-places-firm-order-for-182-embraer-private-jets-valued-at-7-billion/\n25. Flexjet / L Catterton $800m investment (20% stake), 21 Jul 2025 — https://flexjet.com/en-us/press/flexjet-raises-800-million-equity-investment-from-investment-group-led-by-l-catterton\n26. S&P Global Ratings on Vista Global (B+ affirmation), Apr 2026, via PJCC — https://privatejetcardcomparisons.com/2026/04/18/sp-affirms-vista-global-b-rating-based-on-operating-performance/\n27. Flyius platform data (quote requests, operator network), 2025 — flyius.com/press\n\nSecondary compilations and estimates (labeled as such in the text)\n28. Private Jet Card Comparisons — WingX 2025 full-year analysis (3,878,336 departures), 8 Jan 2026 — https://privatejetcardcomparisons.com/2026/01/08/wingx-2025-full-year-private-jet-flight-activity-analysis/ ; 2025's 30 Biggest Charter/Fractional Private Jet Companies (ARGUS TRAQPak data), 23 Feb 2026 — https://privatejetcardcomparisons.com/2026/02/23/2025s-30-biggest-charter-fractional-private-jet-companies/\n29. Forbes — reporting of WingX European traffic data, 11 Jan 2026\n30. Business Airport International — WingX route rankings, H1 2024 — https://bai.mydigitalpublication.co.uk/articles/top-ten-busiest-airports ; SkyAccess empty-leg estimate, 30 Sep 2025; Business Travel Executive via Element Aviation (charter share, undated)\n31. Published operator rate cards for indicative hourly pricing, 2025–26 — BLADE: https://www.blade.com/private-jet-cost ; Stratos; operator-advertised empty-leg discounts (BLADE, Amalfi Jets, 2026); BlackJet (2025 Super Bowl surge pricing, single-operator claim) — https://blackjet.com/post/private-jet-prices-per-hour\n32. Fortune Business Insights, Private Jet Charter Services Market — https://www.fortunebusinessinsights.com/private-jet-charter-services-market-117819 ; Jet Card Market — https://www.fortunebusinessinsights.com/jet-card-market-118441 (research-firm estimates; jet card values not confirmable outside the paywalled report)\n33. Mordor Intelligence, Private Jet Charter Services Market — https://www.mordorintelligence.com/industry-reports/private-jet-charter-services-market (research-firm estimate)\n\nChangelog: v1.0 — published August 2026. Next scheduled update: Q4 2026 (WingX Q3 traffic, GAMA Q3 shipments, Flyius proprietary price medians + empty-leg discount data, downloadable CSV).
Looking to book a private jet?
Get a Free QuoteWritten by
Flyius
Flyius publishes these charter guides. A firm price is confirmed only after an operator quote.